
SECRETS: UK Gov. to stop publishing ‘Deaths by C-19 Vaccination Status’ because the Data has shown for 2.5 years that the COVID Vaccine reduces Lifespan significantly & the Vaccinated account for over 9 in 10 COVID Deaths
Because these figures are mortality rate per 100,000 it cannot be argued that this is because more people have had the Covid-19 vaccine.
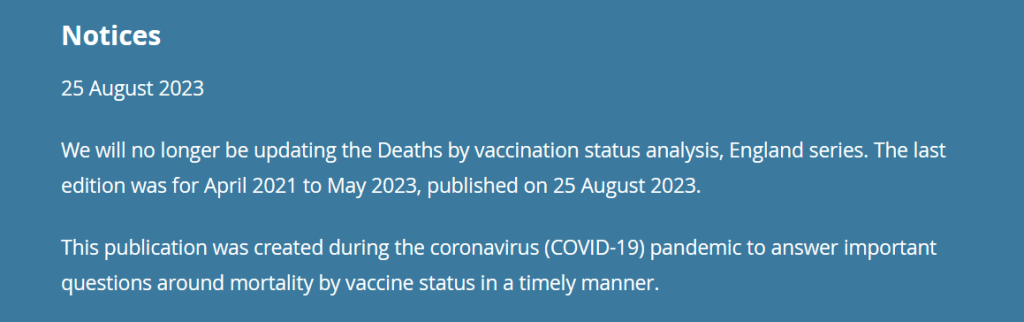
The first dataset was published by the Office for National Statistics (ONS) in late 2021 and covered deaths by vaccination status between 1st January and 31st July 2021. Since then, there have been a further 8 reports produced.
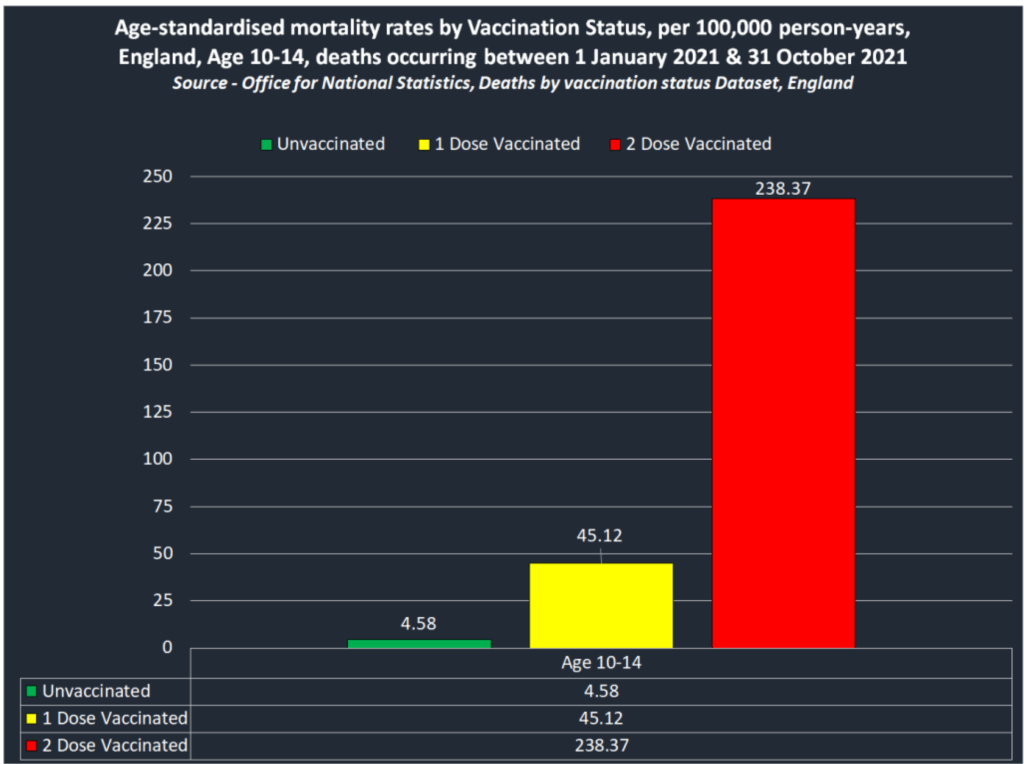
the report published by the Office for National Statistics on 20th Dec 21 inadvertently revealed that COVID-19-vaccinated children were up to 52 times more likely to die of any cause than unvaccinated children.
Here are the calculated mortality rates by vaccination status among 10-14-year-olds based on the ONS calculated person-years contained in the report published 20th Dec 21 –
But the following report from the ONS published 4th Feb 22, failed to include any data on deaths among children whatsoever, suggesting authorities in the UK clearly had something to hide when it comes to the safety of children being given the Covid-19 vaccine.
Then there’s the fact that the reports show COVID-19 vaccination takes approximately five months to kill.
You’ve likely seen many headlines over the past few years on Doctors being baffled by an uptick in “Sudden Adult Death Syndrome” (SADS).

Table 2 of the ONS dataset contains figures on the monthly age-standardised mortality rates by vaccination status for deaths between 1st Jan 21 and 31st May 22. The first COVID-19 injection was administered in England on 8th December 2020, and here are the figures on mortality rates by vaccination status in the following 4 months –
Because these figures are mortality rate per 100,000 it cannot be argued that this is because more people have had the Covid-19 vaccine.

The unvaccinated were substantially more likely to die of any cause other than Covid-19 than the vaccinated population in both January and February 2021, before the rates seemed to normalise by the end of April.
But look at what happened from May 2021 onwards –

All of a sudden, the vaccinated population as a whole were more likely to die than the unvaccinated of any cause other than COVID-19, and this trend has continued month after month since. It also turns out this trend tallies up with those who received the COVID-19 injections first., which went in order of age.
……………………………….
…………………….
The following chart shows the Covid-19 vaccine effectiveness among the triple vaccinated population in England in the Week 3, Week 7 and Week 13 reports of 2022 –
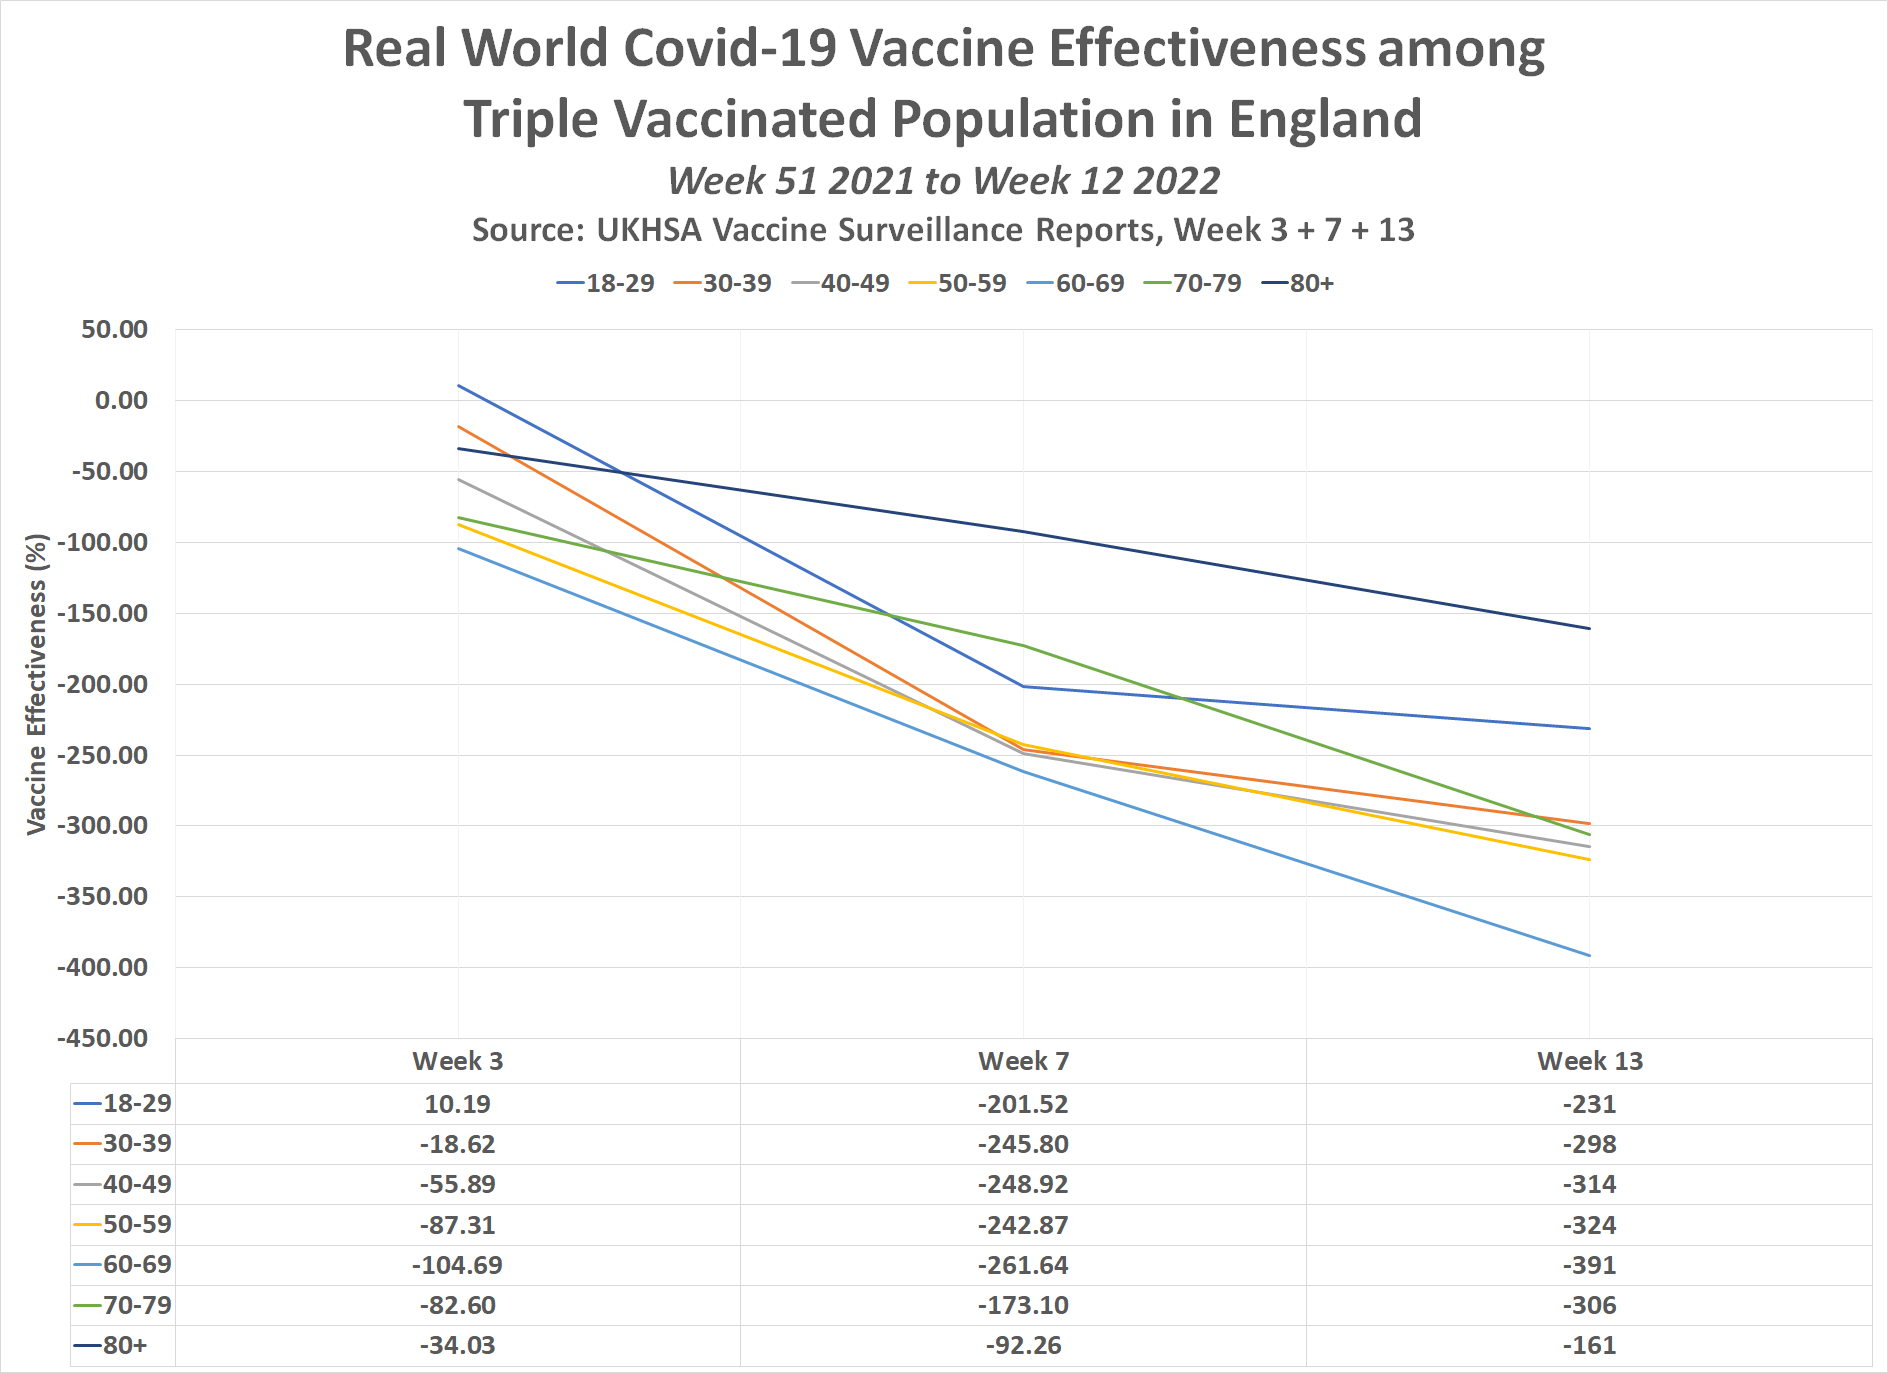
This is nowhere near the claimed 95% effectiveness by Pfizer, is it?
……………………………………..
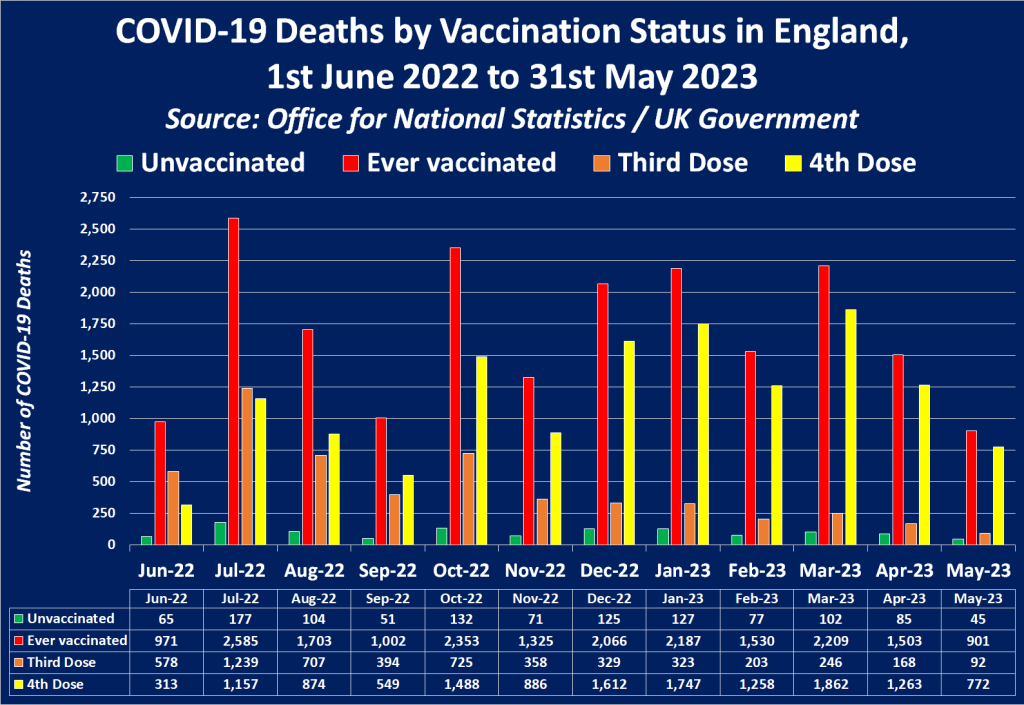
The following chart shows the total number of COVID-19 deaths by vaccinated status throughout the entire year and reveals the true extent of the shocking statistics –

………………………………..
